Bitcoin Cash price is holding the key $220 support against the US Dollar. BCH seems to be aiming for a fresh increase unless there is a move below $220.
Bitcoin cash price is showing positive signs above the $220 level against the US Dollar.
The price is trading above $220 and the 100 simple moving average (4 hours).
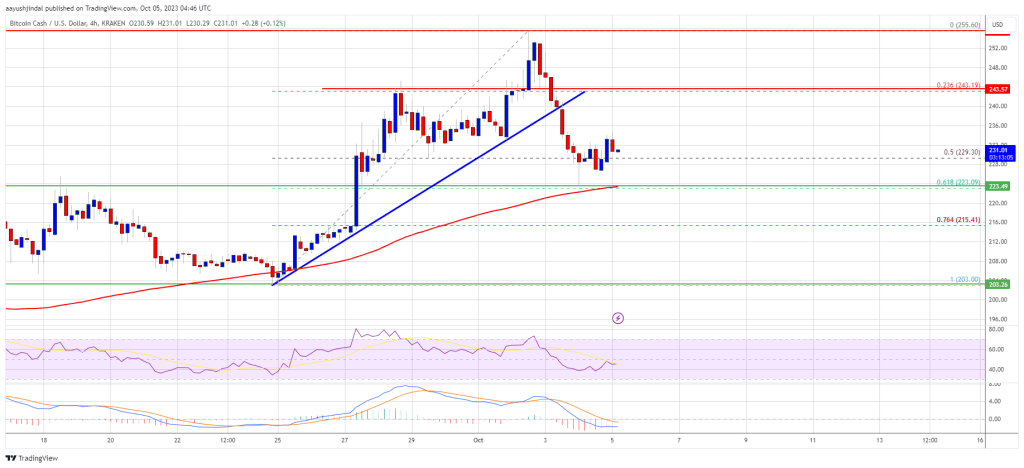
There was a break below a key bullish trend line with support near $238 on the 4-hour chart of the BCH/USD pair (data feed from Kraken).
The pair could start a fresh increase unless there is a move below $220.
In the past few days, Bitcoin Cash price saw a steady decline from the $255 resistance zone. BCH declined below the $240 support to enter a short-term bearish zone, like Bitcoin and Ethereum.
The price declined below the 50% Fib retracement level of the upward move from the $203 swing low to the $255 high. Besides, there was a break below a key bullish trend line with support near $238 on the 4-hour chart of the BCH/USD pair.
However, the bulls were active above the $220 support. The price found support near the 61.8% Fib retracement level of the upward move from the $203 swing low to the $255 high.
Bitcoin Cash is now trading above $220 and the 100 simple moving average (4 hours). Immediate resistance is near the $236 level. The next major resistance is near $244. Any further gains could lead the price toward the $250 resistance zone.
Source: BCH/USD on TradingView.com
The next major hurdle is near the $262 level, above which BCH might start a decent increase toward the $280 level or $288 in the coming days.
If Bitcoin Cash price fails to clear the $244 resistance, it could start a fresh decline. Initial support on the downside is near the $225 level.
The next major support is near the $220 level, where the bulls are likely to appear. If the price fails to stay above the $220 support, the price could test the $212 support. Any further losses could lead the price toward the $200 zone in the near term.
Technical indicators
4-hour MACD – The MACD for BCH/USD is losing pace in the bullish zone.
4-hour RSI (Relative Strength Index) – The RSI is currently below the 50 level.
Key Support Levels – $225 and $220.
Key Resistance Levels – $236 and $244.
[#item_full_content]NewsBTCRead MorePrevious bitcoin bear-market lows followed U.S. midterms, but this year’s recovery raises the possibility that…
Bitcoin rose 0.5% to around $81,700 since midnight UTC while the CoinDesk 80 gained 1.4%…
Bitcoin went quiet after a week of big swings, with tech futures steadying and Brent…
Your day-ahead look for Oct. 23, 2026Read MoreCoinDesk: Bitcoin, Ethereum, Crypto News and Price Data[#item_full_content]
Bitcoin and gold pared early losses as the yen gave up gains and Asian stocks…
Bitcoin Magazine China Moves to Confiscate $5 Billion in Bitcoin From Fraudster Who Fled to…