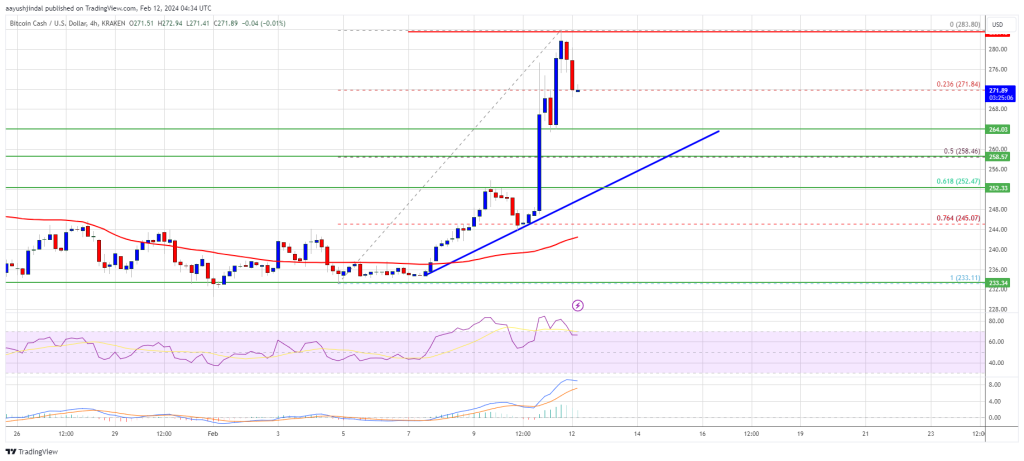
Bitcoin Cash price rallied over 15% and broke the $275 resistance. BCH is now facing strong resistance near the $282 zone.
Bitcoin cash price started a fresh surge above the $250 resistance.
The price is trading above $265 and the 100 simple moving average (4 hours).
There is a key bullish trend line forming with support at $258 on the 4-hour chart of the BCH/USD pair (data feed from Kraken).
The pair could continue to move up if it clears the $282 resistance zone.
After forming a base above the $232 level, Bitcoin Cash price started a steady increase. It broke the $245 resistance to enter a positive zone, like Bitcoin and Ethereum.
There was a strong increase above the $250 and $265 resistance levels. The price gained over 15% and tested the $282 resistance. A high was formed near $283 and the price is now correcting gains. There was a move below the $275 level.
The price tested the 23.6% Fib retracement level of the upward move from the $233 swing low to the $283 high. BCH is now showing positive signs above $260 and the 100 simple moving average (4 hours).
Source: BCH/USD on TradingView.com
There is also a key bullish trend line forming with support at $258 on the 4-hour chart of the BCH/USD pair. If there is another increase, the price might face resistance near $275. To continue higher, the price must settle above $282. The next major resistance is near $292, above which the price might accelerate higher toward the $300 level. Any further gains could lead the price toward the $320 resistance zone.
If Bitcoin Cash price fails to clear the $275 resistance, it could start a fresh decline. Initial support on the downside is near the $265 level.
The next major support is near the $258 level or the trend line. It is close to the 50% Fib retracement level of the upward move from the $233 swing low to the $283 high, where the bulls are likely to appear. If the price fails to stay above the $258 support, the price could test the $245 support. Any further losses could lead the price toward the $232 zone in the near term.
Technical indicators
4-hour MACD – The MACD for BCH/USD is losing pace in the bullish zone.
4-hour RSI (Relative Strength Index) – The RSI is currently in the overbought zone.
Key Support Levels – $265 and $258.
Key Resistance Levels – $275 and $282.
[#item_full_content]NewsBTCRead MoreThe findings suggest attackers could one day steal bitcoin mid-transaction, challenging assumptions that the threat…
Equity futures rallied and oil erased gains on the report, but the S&P 500 is…
The US Labor Department published a proposed regulation on Monday intended to give 401(k) participants…
Bitcoin price started a recovery wave above $67,000. BTC is now consolidating below $68,500 and…
Bitcoin Magazine Labor Department Proposal Could Open 401(k)s to Bitcoin and Alternative Assets The U.S.…
Analyst Willy Woo has highlighted how some old-school Bitcoin on-chain models could suggest a bottoming…