Bitcoin Cash price rallied over 10% and broke the $245 resistance. BCH is now facing strong resistance near the $255 zone.
Bitcoin cash price started a fresh surge above the $232 resistance.
The price is trading above $245 and the 100 simple moving average (4 hours).
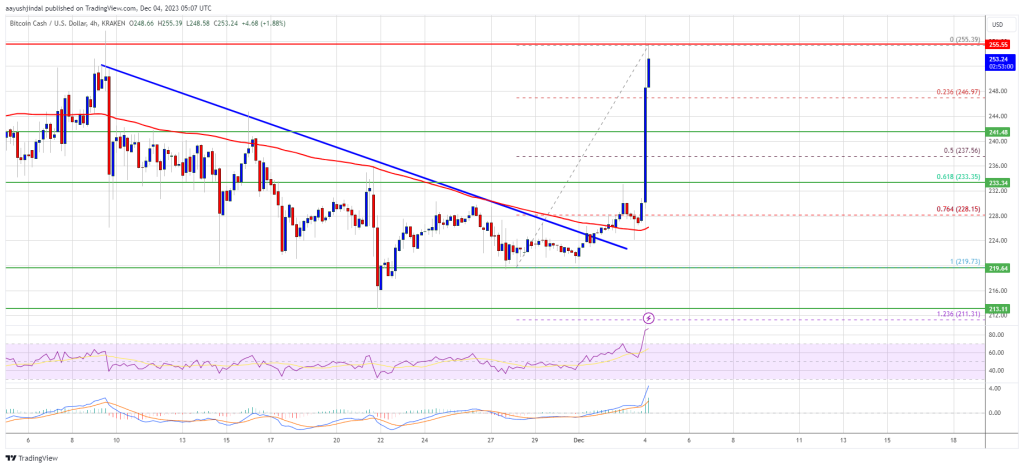
There was a break above a key bearish trend line with resistance near $225 on the 4-hour chart of the BCH/USD pair (data feed from Kraken).
The pair could continue to move up if it clears the $255 resistance zone.
After forming a base above the $220 level, Bitcoin Cash price started a steady increase. It broke the $225 resistance to enter a positive zone, like Bitcoin and Ethereum.
There was a break above a key bearish trend line with resistance near $225 on the 4-hour chart of the BCH/USD pair. There was a strong increase above the $232 and $245 resistance levels. The price is up over 10% and it is now testing the $255 resistance.
BCH is now showing positive signs above $245 and the 100 simple moving average (4 hours). It is also above the 23.6% Fib retracement level of the upward move from the $219 swing low to the $255 high.
Source: BCH/USD on TradingView.com
The price is now struggling to clear the $255 resistance. To continue higher, the price must settle above $255. The next major resistance is near $265, above which the price might accelerate higher toward the $280 level. Any further gains could lead the price toward the $300 resistance zone.
If Bitcoin Cash price fails to clear the $255 resistance, it could start a fresh decline. Initial support on the downside is near the $245 level.
The next major support is near the $232 level or the 61.8% Fib retracement level of the upward move from the $219 swing low to the $255 high, where the bulls are likely to appear. If the price fails to stay above the $232 support, the price could test the $225 support. Any further losses could lead the price toward the $220 zone in the near term.
Technical indicators
4-hour MACD – The MACD for BCH/USD is gaining pace in the bullish zone.
4-hour RSI (Relative Strength Index) – The RSI is currently in the overbought zone.
Key Support Levels – $245 and $232.
Key Resistance Levels – $255 and $265.
[#item_full_content]NewsBTCRead MoreCapital rotation into artificial intelligence may have played a bigger role in Bitcoin’s latest selloff…
Bitcoin price performance in June has gotten off to a rocky start, with prices now…
A crypto analyst has shared a detailed forecast outlining when Bitcoin could regain bullish momentum…
A week that began with Strategy's bitcoin sale ended with one of the largest crypto…
Bitcoin is facing a pivotal moment after a sharp market-wide selloff dragged prices toward a…
Sourcing initial capital from his mother to build a $1 billion crypto empire, DFG CEO…