Bitcoin Cash price rallied over 10% and broke the $245 resistance. BCH is now facing strong resistance near the $255 zone.
Bitcoin cash price started a fresh surge above the $232 resistance.
The price is trading above $245 and the 100 simple moving average (4 hours).
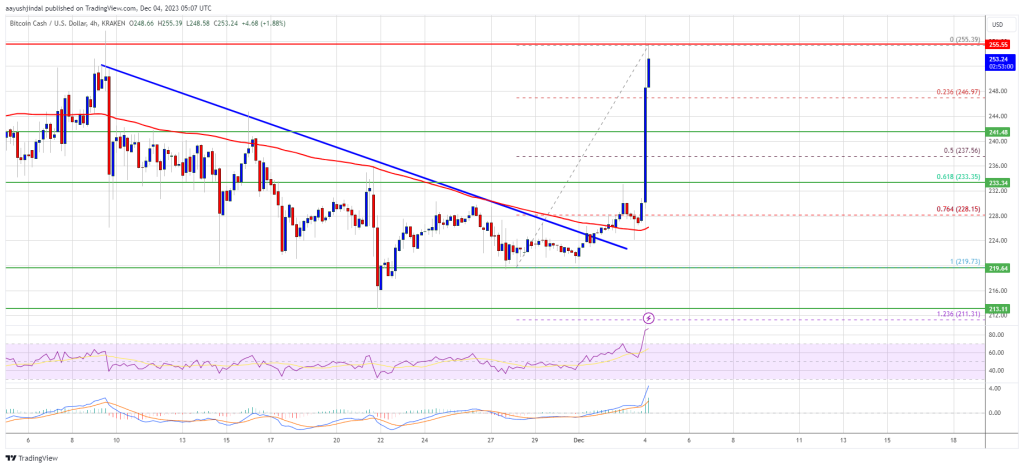
There was a break above a key bearish trend line with resistance near $225 on the 4-hour chart of the BCH/USD pair (data feed from Kraken).
The pair could continue to move up if it clears the $255 resistance zone.
After forming a base above the $220 level, Bitcoin Cash price started a steady increase. It broke the $225 resistance to enter a positive zone, like Bitcoin and Ethereum.
There was a break above a key bearish trend line with resistance near $225 on the 4-hour chart of the BCH/USD pair. There was a strong increase above the $232 and $245 resistance levels. The price is up over 10% and it is now testing the $255 resistance.
BCH is now showing positive signs above $245 and the 100 simple moving average (4 hours). It is also above the 23.6% Fib retracement level of the upward move from the $219 swing low to the $255 high.
Source: BCH/USD on TradingView.com
The price is now struggling to clear the $255 resistance. To continue higher, the price must settle above $255. The next major resistance is near $265, above which the price might accelerate higher toward the $280 level. Any further gains could lead the price toward the $300 resistance zone.
If Bitcoin Cash price fails to clear the $255 resistance, it could start a fresh decline. Initial support on the downside is near the $245 level.
The next major support is near the $232 level or the 61.8% Fib retracement level of the upward move from the $219 swing low to the $255 high, where the bulls are likely to appear. If the price fails to stay above the $232 support, the price could test the $225 support. Any further losses could lead the price toward the $220 zone in the near term.
Technical indicators
4-hour MACD – The MACD for BCH/USD is gaining pace in the bullish zone.
4-hour RSI (Relative Strength Index) – The RSI is currently in the overbought zone.
Key Support Levels – $245 and $232.
Key Resistance Levels – $255 and $265.
[#item_full_content]NewsBTCRead MoreWhat to Know: Block Inc. is cutting 10% of its staff to cap headcount at…
What to Know: Bitcoin claiming $70,000 confirms a bull market structure, targeting $100,000 driven by…
What to Know: Institutional analysis confirms the quantum threat to Bitcoin is real but mitigated…
The key point is that most of the potentially exposed bitcoin isn’t sitting in a…
The watchdog said it plans to build tools that automatically extract suspicious trading patterns by…
Bitcoin price started a recovery wave from $60,000. BTC is now consolidating gains above $70,000…