Bitcoin Cash price is holding the key $205 support against the US Dollar. BCH could start a fresh increase if it stays above the $205 and $200 support levels.
Bitcoin cash price started a fresh decline below the $230 level against the US Dollar.
The price is trading below $220 and the 100 simple moving average (4 hours).
There is a key bearish trend line forming with resistance near $217 on the 4-hour chart of the BCH/USD pair (data feed from Kraken).
The pair could start a fresh increase unless there is a move below $200.
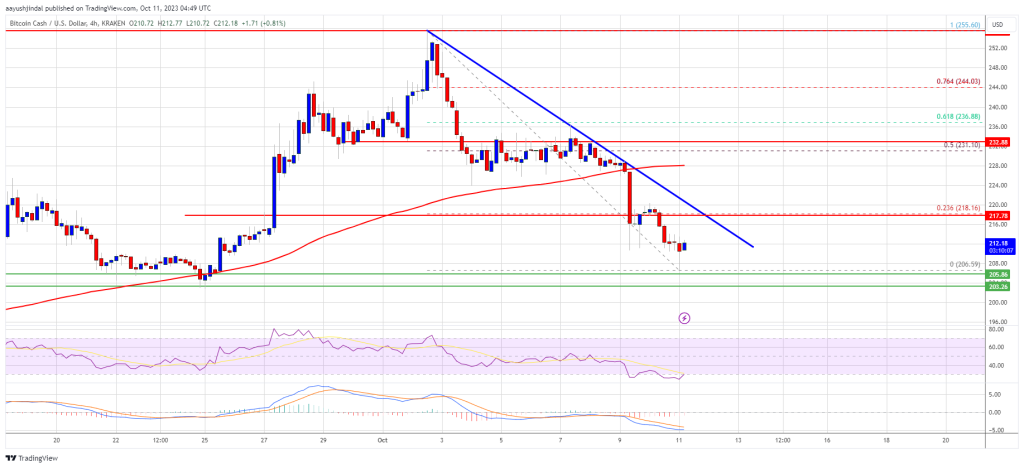
In the past few days, Bitcoin Cash price saw a steady decline from the $255 resistance zone. BCH declined below the $232 support to enter a short-term bearish zone, like Bitcoin and Ethereum.
The bears were able to push the price below the $220 support. Finally, the price found support near the $205 zone (a multi-touch zone). A low has formed near $206.59 and the price is now consolidating losses. It seems like there is a key bearish trend line forming with resistance near $217 on the 4-hour chart of the BCH/USD pair.
Bitcoin Cash is now trading below $220 and the 100 simple moving average (4 hours). Immediate resistance is near the $217 level and the trend line. It is close to the 23.6% Fib retracement level of the downward move from the $255 swing high to the $206 low.
Source: BCH/USD on TradingView.com
The next major resistance is near $228 or the 100 simple moving average (4 hours). The next major resistance is near the $232 level. It is close to the 50% Fib retracement level of the downward move from the $255 swing high to the $206 low. Any further gains could lead the price toward the $250 resistance zone.
If Bitcoin Cash price fails to clear the $217 resistance, it could continue to move down. Initial support on the downside is near the $205 level.
The next major support is near the $200 level, where the bulls are likely to appear. If the price fails to stay above the $200 support, the price could test the $184 support. Any further losses could lead the price toward the $162 zone in the near term.
Technical indicators
4-hour MACD – The MACD for BCH/USD is losing pace in the bearish zone.
4-hour RSI (Relative Strength Index) – The RSI is currently below the 50 level.
Key Support Levels – $205 and $200.
Key Resistance Levels – $217 and $232.
[#item_full_content]NewsBTCRead MoreCryptos bounced on Trump’s five-day pause announcement, but the next move hinges on whether tensions…
Market expert Ali Martinez recently revealed on X (formerly Twitter) what he describes as “the…
Bitcoin’s recent price stagnation reflects a market grappling with uncertainty, and confidence being tested not…
Bitcoin Magazine Bitcoin Swings Wildly as Iran Ceasefire Drama Rocks Crypto Markets Bitcoin kicked off…
Crypto analyst Celal has predicted that the Bitcoin price could hit a new all-time high…
Bitcoin is once again testing a critical level that could shape its next major move.…