Bitcoin Cash price started a major increase above the $475 resistance. BCH is consolidating and might aim for more gains above the $500 resistance.
Bitcoin cash price started a fresh increase above the $480 level.
The price is trading above $480 and the 100-hour simple moving average.
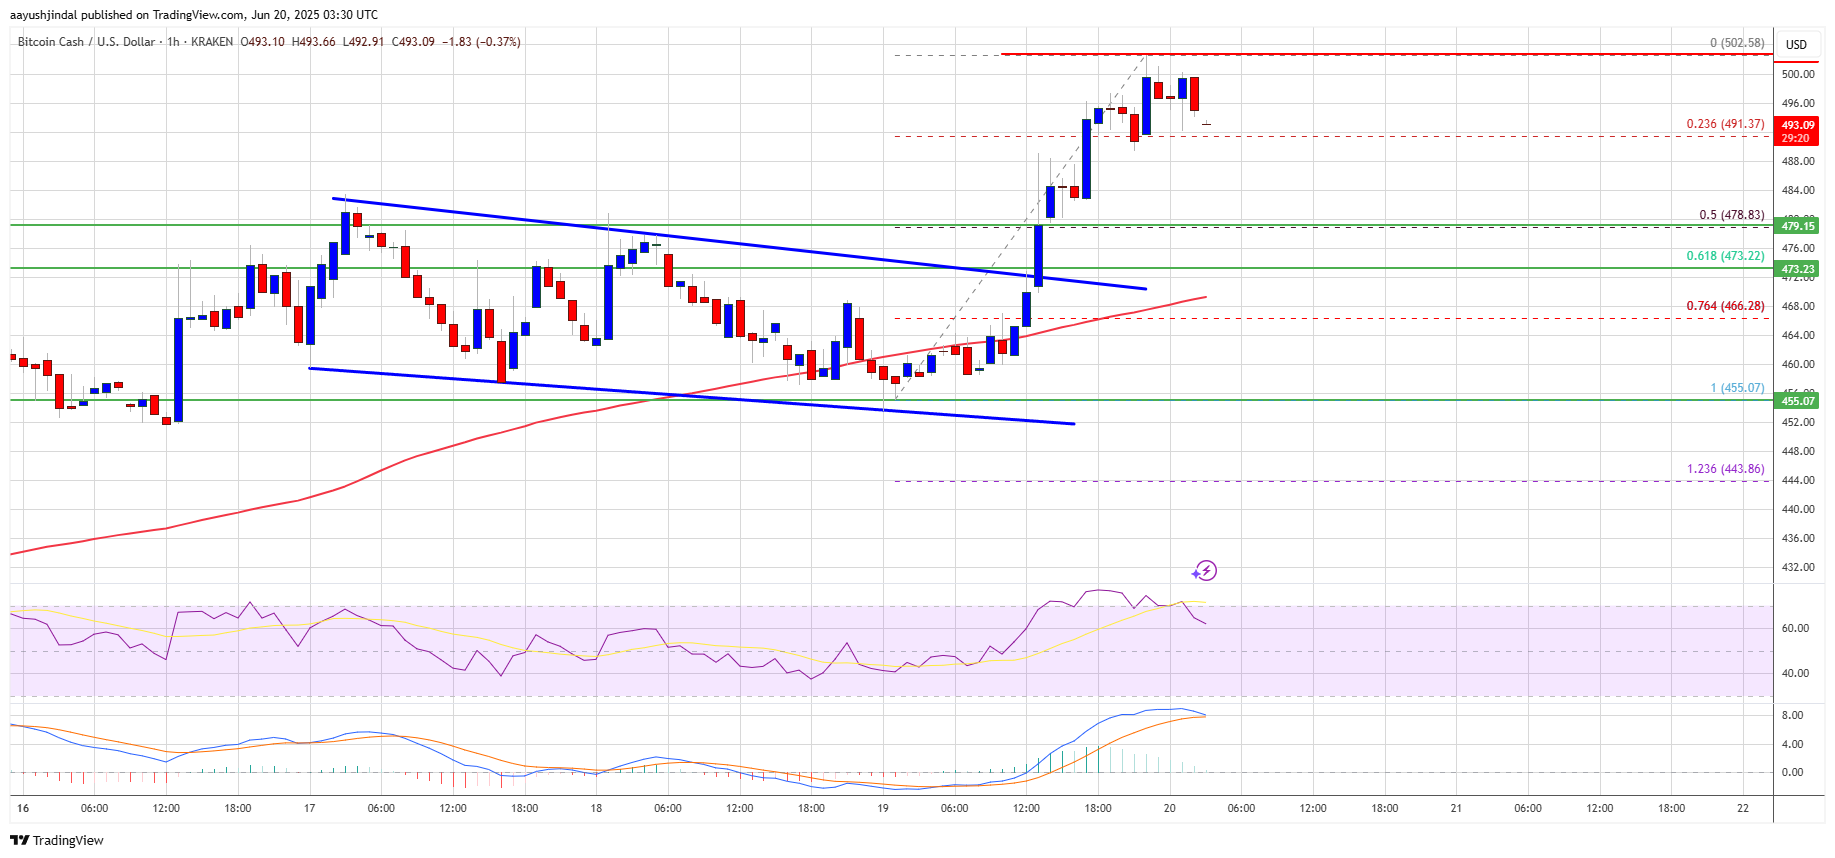
There was a break above a key bearish trend line with resistance at $472 on the hourly chart of the BCH/USD pair (data feed from Kraken).
The pair could start another increase if it clears the $500 resistance zone.
After forming a base above the $440 level, Bitcoin Cash price started a fresh increase. BCH outpaced Bitcoin and Ethereum to gain over 8%. There was a clear move above the $470 resistance zone.
The price even surpassed $480 and tested the $495 resistance zone. Besides, there was a break above a key bearish trend line with resistance at $472 on the hourly chart of the BCH/USD pair. A high was formed near $505 and the price is now consolidating gains above the 23.6% Fib retracement level of the upward move from the $455 swing low to the $502 high.
Bitcoin cash price is now trading above $485 and the 100-hour simple moving average. Immediate resistance on the upside sits near the $500 level. A clear move above the $500 resistance might start a decent increase. The next major resistance is $505, above which the price might accelerate higher toward the $520 level. Any further gains could lead the price toward the $535 resistance zone.
If Bitcoin Cash price fails to clear the $500 resistance, it could start a fresh decline. Initial support on the downside is near the $490 level. The next major support is near the $480 level or the 50% Fib retracement level of the upward move from the $455 swing low to the $502 high.
If the price fails to stay above the $480 support, the price could test the $470 support. Any further losses could lead the price toward the $450 zone in the near term.
Technical indicators
4-hour MACD – The MACD for BCH/USD is losing pace in the bullish zone.
4-hour RSI (Relative Strength Index) – The RSI is currently above the 60 level.
Key Support Levels – $490 and $480.
Key Resistance Levels – $500 and $505.
[#item_full_content]NewsBTCRead MoreBitcoin traded around $69,800 as open interest rose to $102 billion, suggesting defensive, bearish bets…
Bitcoin (BTC) is currently navigating a trading range between $60,000 and $73,000, entering what analytics…
Tokyo-listed Metaplanet is expanding beyond holding BTC into funding, incubating, and granting to companies building…
The bridging protocol's team wants to exchange ACX tokens for equity in a new U.S.…
Brent crude surged 10% after attacks on two oil tankers in Iraqi waters, with the…
Bitcoin price failed to extend its recovery wave above the $70,500 zone. BTC is now…