Bitcoin price started a downside correction from the $35,000 resistance. BTC could start a fresh increase unless there is a move below $32,800.
Bitcoin rallied toward the $35,000 resistance before the bears appeared.
The price is trading above $33,200 and the 100 hourly Simple moving average.
There is a key breakout pattern forming with resistance near $34,050 on the hourly chart of the BTC/USD pair (data feed from Kraken).
The pair could correct lower toward the $33,000 zone before it starts a fresh increase.
Bitcoin price rallied over 15% after there was speculation of spot ETF being listed DTCC. BTC surged toward the $35,000 resistance zone before the bears appeared.
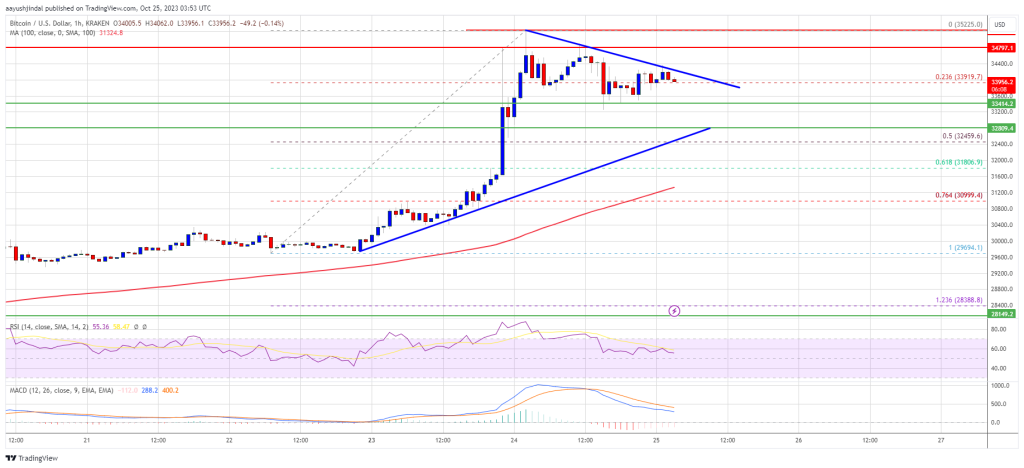
A new multi-week high was formed near $35,225. Recently, the price started a downside correction below the $34,500 level. There was a move below the 23.6% Fib retracement level of the upward move from the $29,694 swing low to the $35,225 high.
Bitcoin is now trading above $33,200 and the 100 hourly Simple moving average. There is also a key breakout pattern forming with resistance near $34,050 on the hourly chart of the BTC/USD pair. The triangle support is close to the 50% Fib retracement level of the upward move from the $29,694 swing low to the $35,225 high.
On the upside, immediate resistance is near the $34,050 level. The next key resistance could be near $34,800. The main resistance is now forming near the $35,000 zone.
Source: BTCUSD on TradingView.com
A clear move above the $35,000 barrier might send the price toward the $36,200 resistance. The next key resistance could be $37,000. Any more gains might send BTC toward the $38,000 level in the coming days.
If Bitcoin fails to rise above the $34,050 resistance zone, it could continue to move down. Immediate support on the downside is near the $33,400 level.
The next major support is near the $32,800 level and the triangle trend line. If there is a move below the trend line support, the price may perhaps decline toward the $31,500 level in the coming sessions.
Technical indicators:
Hourly MACD – The MACD is now losing pace in the bullish zone.
Hourly RSI (Relative Strength Index) – The RSI for BTC/USD is now above the 50 level.
Major Support Levels – $33,400, followed by $32,800.
Major Resistance Levels – $34,050, $34,800, and $35,000.
[#item_full_content]NewsBTCRead MoreBTC holds near $70,000 and outperforms major assets during Middle East tensions, even as derivatives…
Two Prime CEO Alexander Blume says the high yield product driving the buying surge carries…
Your day-ahead look for March 12, 2026Read MoreCoinDesk: Bitcoin, Ethereum, Crypto News and Price Data[#item_full_content]
The futures-to-spot ratio has climbed to 5.1, reflecting a structural shift in how the market…
Bitcoin traded around $69,800 as open interest rose to $102 billion, suggesting defensive, bearish bets…
Bitcoin (BTC) is currently navigating a trading range between $60,000 and $73,000, entering what analytics…