Bitcoin price gained pace and traded above $23,000. BTC is consolidating gains and might start another increase towards $23,500.
Bitcoin traded to a new yearly high at $23,428 before it started a downside correction.
The price is trading above $22,000 and the 100 hourly simple moving average.
There is a major bullish trend line forming with support near $22,000 on the hourly chart of the BTC/USD pair (data feed from Kraken).
The pair could start a fresh increase if it stays above the $22,000 support zone.
Bitcoin price started a major increase above the $21,500 resistance zone. BTC gained pace and even broke the $22,000 resistance zone, similar to ethereum at $1,550.
The price surged above the $22,500 level and settled well above the 100 hourly simple moving average. It traded to a new yearly high at $23,428 and recently started a minor downside correction. There was a minor move below the $23,000 level.
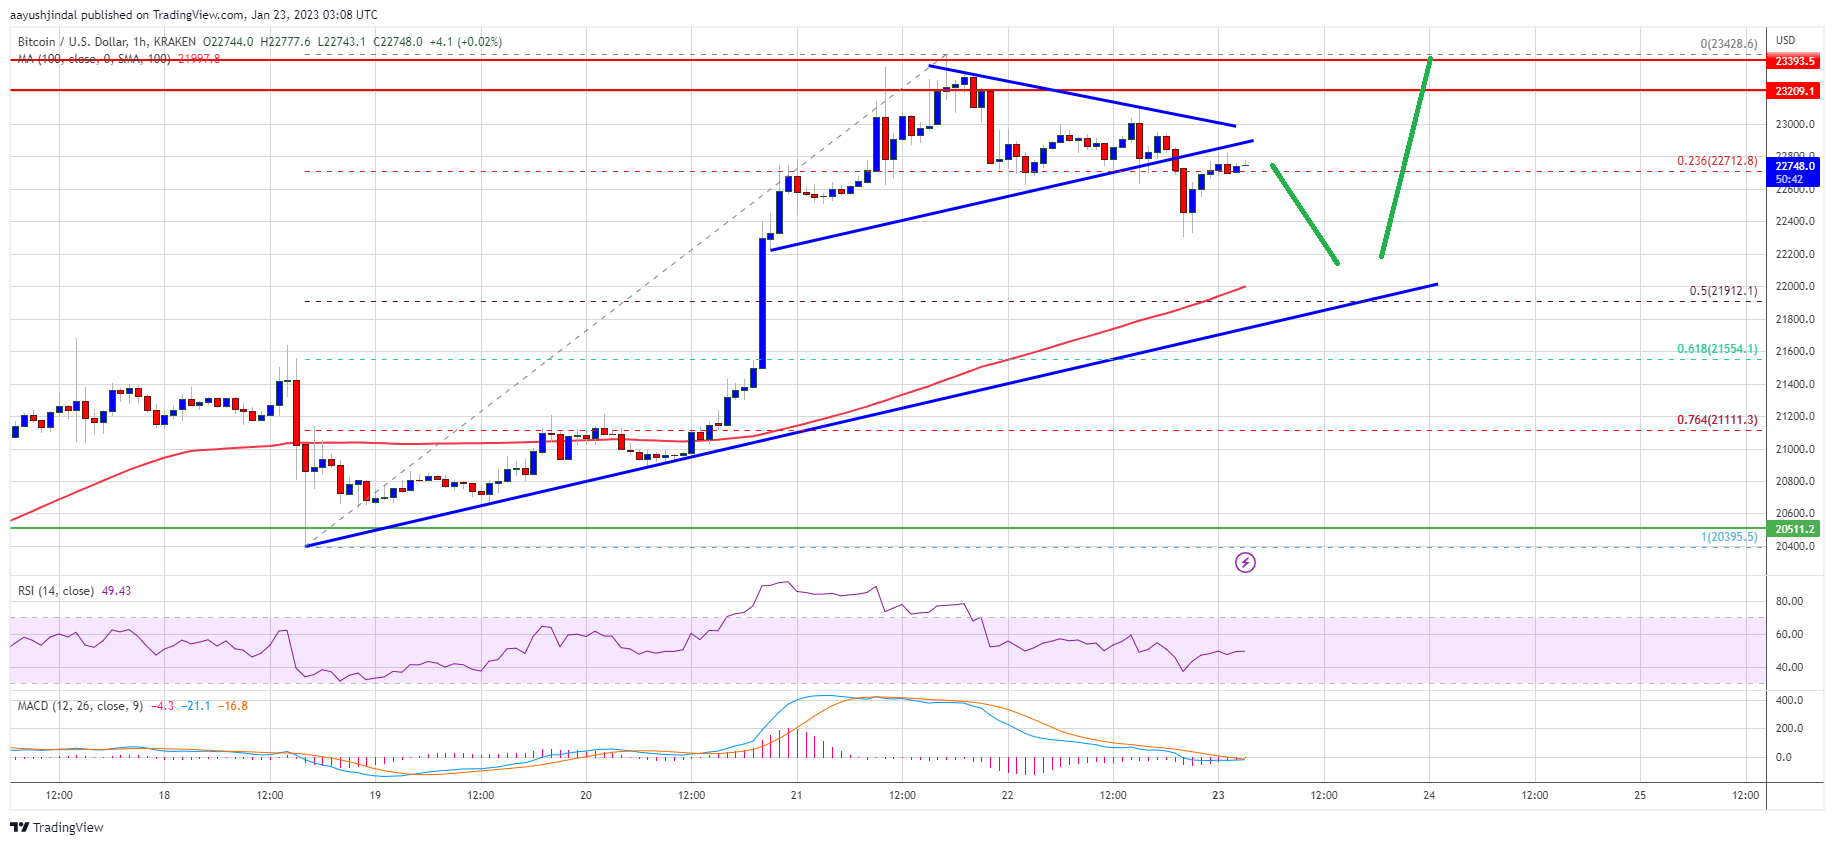
Bitcoin price declined below the 23.6% Fib retracement level of the upward move from the $20,395 swing low to $24,248 high. However, the price is still trading above $22,000 and the 100 hourly simple moving average.
There is also a major bullish trend line forming with support near $22,000 on the hourly chart of the BTC/USD pair. An immediate resistance is near the $23,000 level. The next major resistance is near the $23,200 zone, above which the price might gain bullish momentum.
Source: BTCUSD on TradingView.com
In the stated case, the price may perhaps rise towards the $23,500 level. Any more gains might send btc price towards the $24,500 level.
If bitcoin price fails to clear the $23,000 resistance, it could continue to move down. An immediate support on the downside is near the $22,400 zone.
The next major support is near the $22,000 zone and the trend line. It is close to the 50% Fib retracement level of the upward move from the $20,395 swing low to $24,248 high, below which the price might gain bearish momentum and test $21,200. Any more losses might send the price to $20,500 in the near term.
Technical indicators:
Hourly MACD – The MACD is now losing pace in the bearish zone.
Hourly RSI (Relative Strength Index) – The RSI for BTC/USD is now above the 50 level.
Major Support Levels – $22,400, followed by $22,000.
Major Resistance Levels – $23,000, $23,200 and $23,500.
Bitcoin price gained pace and traded above $23,000. BTC is consolidating gains and might start another increase towards $23,500.
Bitcoin traded to a new yearly high at $23,428 before it started a downside correction.
The price is trading above $22,000 and the 100 hourly simple moving average.
There is a major bullish trend line forming with support near $22,000 on the hourly chart of the BTC/USD pair (data feed from Kraken).
The pair could start a fresh increase if it stays above the $22,000 support zone.
Bitcoin price started a major increase above the $21,500 resistance zone. BTC gained pace and even broke the $22,000 resistance zone, similar to ethereum at $1,550.
The price surged above the $22,500 level and settled well above the 100 hourly simple moving average. It traded to a new yearly high at $23,428 and recently started a minor downside correction. There was a minor move below the $23,000 level.
Bitcoin price declined below the 23.6% Fib retracement level of the upward move from the $20,395 swing low to $24,248 high. However, the price is still trading above $22,000 and the 100 hourly simple moving average.
There is also a major bullish trend line forming with support near $22,000 on the hourly chart of the BTC/USD pair. An immediate resistance is near the $23,000 level. The next major resistance is near the $23,200 zone, above which the price might gain bullish momentum.
Source: BTCUSD on TradingView.com
In the stated case, the price may perhaps rise towards the $23,500 level. Any more gains might send btc price towards the $24,500 level.
If bitcoin price fails to clear the $23,000 resistance, it could continue to move down. An immediate support on the downside is near the $22,400 zone.
The next major support is near the $22,000 zone and the trend line. It is close to the 50% Fib retracement level of the upward move from the $20,395 swing low to $24,248 high, below which the price might gain bearish momentum and test $21,200. Any more losses might send the price to $20,500 in the near term.
Technical indicators:
Hourly MACD – The MACD is now losing pace in the bearish zone.
Hourly RSI (Relative Strength Index) – The RSI for BTC/USD is now above the 50 level.
Major Support Levels – $22,400, followed by $22,000.
Major Resistance Levels – $23,000, $23,200 and $23,500.
Tags: bitcoinbitcoin pricebtcusdBTCUSDTxbtusd
NewsBTCRead More
The Bitcoin price has been trading below $100,000 for months now, and there has been…
The latest Bitcoin (BTC) price drop has raised concerns about the cryptocurrency’s upcoming performance, with…
The average public miner spent $79,995 to produce one bitcoin last quarter. Bitcoin is trading…
Investor sentiment in the crypto market sits at its lowest point in months — and…
A veteran Bitcoin evangelist who entered the market when most people had never heard the…
Bitcoin Magazine Morgan Stanley Set to Undercut Bitcoin ETF Rivals With 0.14% Fee Ahead of…