Bitcoin price started a fresh increase above the $29,000 resistance. BTC could rally if there is a clear move above the $30,000 resistance.
Bitcoin is moving higher above the $28,800 and $29,000 resistance levels.
The price is trading above $28,800 and the 100 hourly Simple moving average.
There is a major contracting triangle forming with support near $29,250 on the hourly chart of the BTC/USD pair (data feed from Kraken).
The pair could continue to rise if it clears the $29,800 and $30,000 resistance levels.
Bitcoin price remained strong above the $28,000 support zone. BTC bulls were active and were able to pump the price above the $28,500 resistance zone.
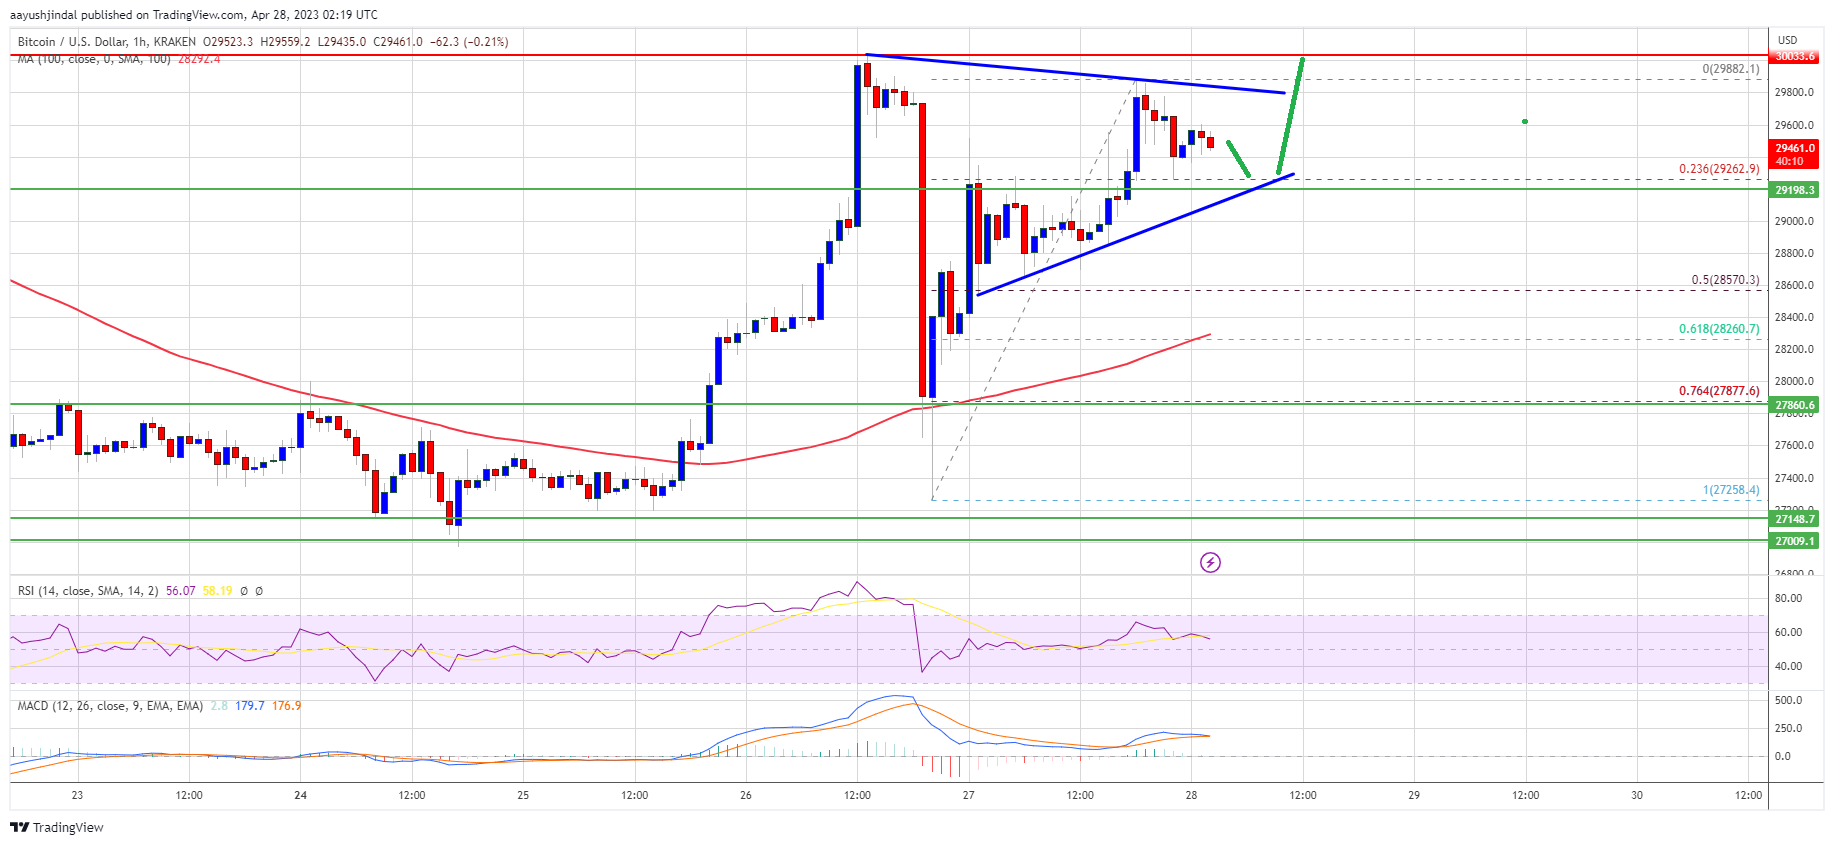
There was a steady increase above the $28,800 and $29,000 resistance levels. The price traded close to the $30,000 resistance zone. A high is formed near $29,882 and the price is now consolidating gains. Bitcoin is trading above $28,800 and the 100 hourly Simple moving average.
There is also a major contracting triangle forming with support near $29,250 on the hourly chart of the BTC/USD pair. The triangle support is close to the 23.6% Fib retracement level of the upward move from the $27,258 swing low to the $29,882 high.
Source: BTCUSD on TradingView.com
Immediate resistance is near the $29,800 level and the triangle trend line. The next major resistance sits near the $30,000 zone. A close above the $30,000 resistance could send Bitcoin toward $30,500. Any more gains could open the doors for a test of the key barrier at $31,200.
If Bitcoin’s price fails to clear the $29,800 resistance, it could again start a fresh decline. Immediate support on the downside is near the $29,250 level and the triangle region.
A downside break below the triangle might send the price toward the 50% Fib retracement level of the upward move from the $27,258 swing low to the $29,882 high. The next major support is near the $28,250 zone or the 100 hourly Simple moving average. Any more losses might take Bitcoin toward $27,800 in the near term.
Technical indicators:
Hourly MACD – The MACD is now gaining pace in the bullish zone.
Hourly RSI (Relative Strength Index) – The RSI for BTC/USD is now above the 50 level.
Major Support Levels – $29,250, followed by $28,550.
Major Resistance Levels – $29,800, $30,000, and $30,500.
[#item_full_content]NewsBTCRead MoreA key momentum indicator that has been accurate at calling price selloffs since October just…
Bitcoin shows early signs of outperformance against gold, with the BTC gold ratio rebounding toward…
BTC slipped back into February's range after Donald Trump threatened to attack Iran's power plants,…
The Bitcoin price broke below $70,000 over the weekend, effectively erasing the gains from the…
The Iran conflict's fourth week is breaking the traditional safe-haven playbook, with gold down to…
Stocks look to be catching with BTC's earlier crash to nearly $60,000.Read MoreCoinDesk: Bitcoin, Ethereum,…