Bitcoin price is attempting a fresh increase above the $42,500 resistance. BTC is showing bullish signs and might rally further above the $43,800 resistance.
Bitcoin price is consolidating gains above the $42,500 resistance zone.
The price is trading above $42,750 and the 100 hourly Simple moving average.
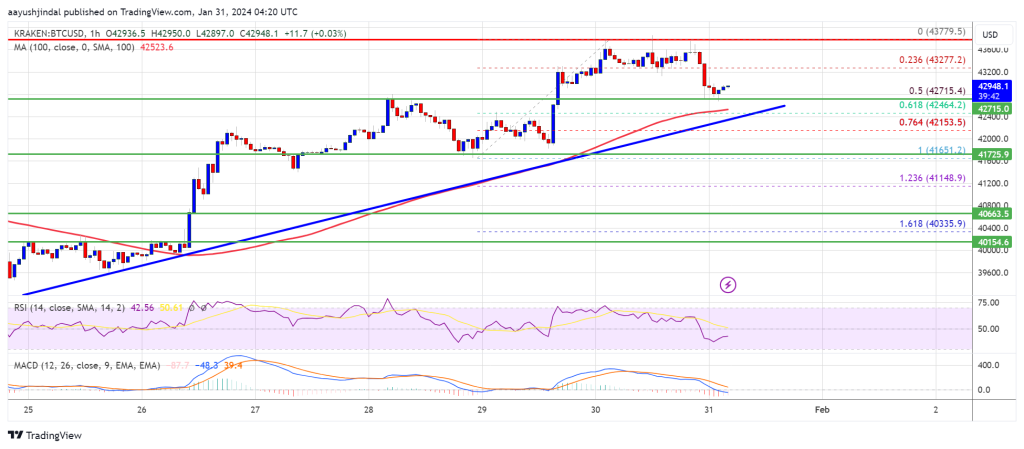
There is a key bullish trend line forming with support near $42,650 on the hourly chart of the BTC/USD pair (data feed from Kraken).
The pair could continue to rise if it clears the $43,250 and $43,800 resistance levels.
Bitcoin price started a decent increase above the $42,000 resistance zone. BTC was able to clear the $42,500 and $43,200 resistance levels. However, the bears were active near the $43,800 zone.
A new weekly high was formed near $43,779 before the price started a short-term downside correction. There was a drop below the $43,200 level. It broke the 23.6% Fib retracement level of the upward wave from the $41,650 swing low to the $43,779 high.
Bitcoin is now trading above $42,750 and the 100 hourly Simple moving average. There is also a key bullish trend line forming with support near $42,650 on the hourly chart of the BTC/USD pair. The trend line is near the 61.8% Fib retracement level of the upward wave from the $41,650 swing low to the $43,779 high.
Immediate resistance is near the $43,250 level. The next key resistance could be $43,800, above which the price could start a decent increase. The next stop for the bulls may perhaps be $44,500.
Source: BTCUSD on TradingView.com
A clear move above the $44,500 resistance could send the price toward the $45,000 resistance. The next resistance is now forming near the $45,200 level. A close above the $45,200 level could push the price further higher. The next major resistance sits at $46,500.
If Bitcoin fails to rise above the $43,800 resistance zone, it could continue to move down. Immediate support on the downside is near the $42,800 level.
The next major support is $42,650 or the trend line. The main support could be $42,400 and the 100 hourly SMA. If there is a close below $42,400, the price could gain bearish momentum. In the stated case, the price could dive toward the $41,200 support.
Technical indicators:
Hourly MACD – The MACD is now losing pace in the bullish zone.
Hourly RSI (Relative Strength Index) – The RSI for BTC/USD is now below the 50 level.
Major Support Levels – $42,650, followed by $42,400.
Major Resistance Levels – $43,250, $43,800, and $44,500.
[#item_full_content]NewsBTCRead MoreThe alleged theft of 2,323 bitcoin has triggered a High Court dispute testing how English…
Bitcoin Magazine Bitcoin at Key Support Levels — Why Jack Mallers Says Turn On DCA…
Data shows the Bitcoin Fear & Greed Index has marked an improvement after the latest…
Bitcoin Magazine Eric Trump Confirmed As Speaker For Bitcoin 2026 Conference Bitcoin Magazine has confirmed…
Bitcoin Magazine Bitcoin’s Ownership Base is Maturing, Reducing Reliance on Retail: Analysts Bitcoin investors have…
“The wildest thing about my $1 million prediction is that it's not wild at all,”…