Bitcoin price attempted a fresh increase above the $26,500 resistance. However, BTC failed to settle above $26,700 and reacted to the downside.
Bitcoin is still struggling to clear $26,500 and $26,700.
The price is trading above $26,200 and the 100 hourly Simple moving average.
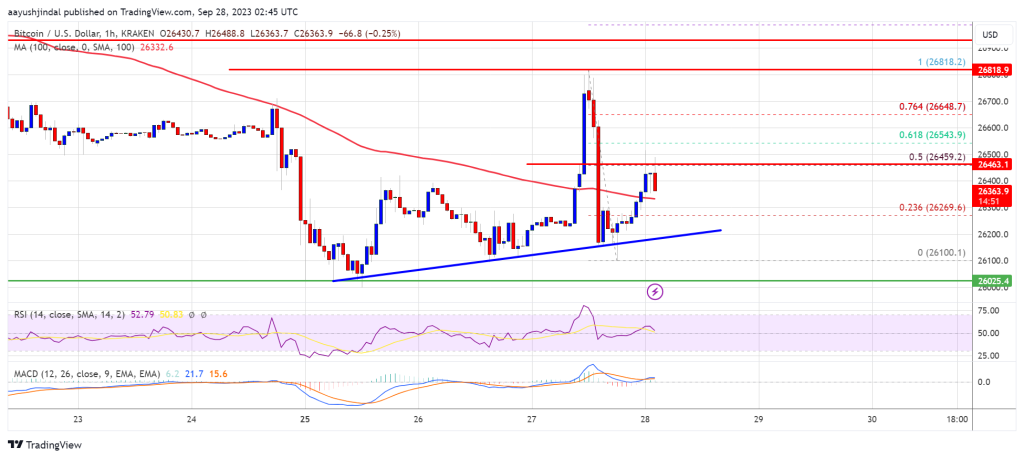
There is a connecting bullish trend line forming with support near $26,200 on the hourly chart of the BTC/USD pair (data feed from Kraken).
The pair could again climb higher unless there is a close below $26,200 and $26,000.
Bitcoin price started a decent recovery wave from the $26,000 support zone. BTC climbed higher above the $26,350 and $26,500 resistance levels.
The price even spiked above the $26,700 resistance. However, the bears defended more gains. A high was formed near $26,818 and there was a strong rejection pattern. The price trimmed all gains and declined below the $26,500 level.
It even dived below $26,200. A low is formed near $26,100 and the price is now attempting a fresh increase. Bitcoin is trading above $26,200 and the 100 hourly Simple moving average. There is also a connecting bullish trend line forming with support near $26,200 on the hourly chart of the BTC/USD pair.
Immediate resistance on the upside is near the $26,450 level. It is close to the 50% Fib retracement level of the downward move from the $26,818 swing high to the $26,100 low.
Source: BTCUSD on TradingView.com
The next key resistance could be near the $26,650 level or the 76.4% Fib retracement level of the downward move from the $26,818 swing high to the $26,100 low. To start a recovery wave, the price must settle above $26,650. In the stated case, the price could climb toward the $27,000 resistance. Any more gains might call for a move toward the $27,500 level.
If Bitcoin fails to start a fresh increase above the $26,450 resistance, it could start another decline. Immediate support on the downside is near the $26,200 level and the trend line.
The next major support is near the $26,000 level. A downside break and close below the $26,000 level might start another major decline. The next support sits at $25,400. Any more losses might call for a test of $25,000.
Technical indicators:
Hourly MACD – The MACD is now losing pace in the bearish zone.
Hourly RSI (Relative Strength Index) – The RSI for BTC/USD is now above the 50 level.
Major Support Levels – $26,200, followed by $26,000.
Major Resistance Levels – $26,450, $26,650, and $27,000.
[#item_full_content]NewsBTCRead MoreBitcoin Magazine Bitcoin Core Ends Long Embargoes for Bugs AI Can Rediscover Bitcoin Core has…
Bitcoin Magazine Bitcoin ETFs Lose Over $635M In One Day Following Oil Price Spike U.S.…
Bitcoin Magazine Franklin Templeton Clears Final Hurdle For ETFs That Turn Stock Dividends Into Bitcoin…
Developers merged a policy change that ends the months-long embargo for flaws a chatbot could…
The company's head of futures and prediction markets said bitcoin, gold and oil contracts are…
▶ Bitcoin Magazine Bloomberg’s Mike McGlone: AI Risk Could Force Bitcoin Drawdown to $10,000 Mike…