Bitcoin price rallied above the $27,500 resistance. BTC is consolidating near $28,000 and might start a minor downside correction in the near term.
Bitcoin gained pace above the $27,200 and $27,500 resistance levels.
The price is trading above $27,500 and the 100 hourly Simple moving average.
There is a key bullish trend line forming with support near $27,350 on the hourly chart of the BTC/USD pair (data feed from Kraken).
The pair is signaling more gains above $28,000 after a mild downside correction.
Bitcoin price started a decent increase above the $27,000 resistance zone. BTC gained pace for a move above the $27,200 and $27,500 resistance levels.
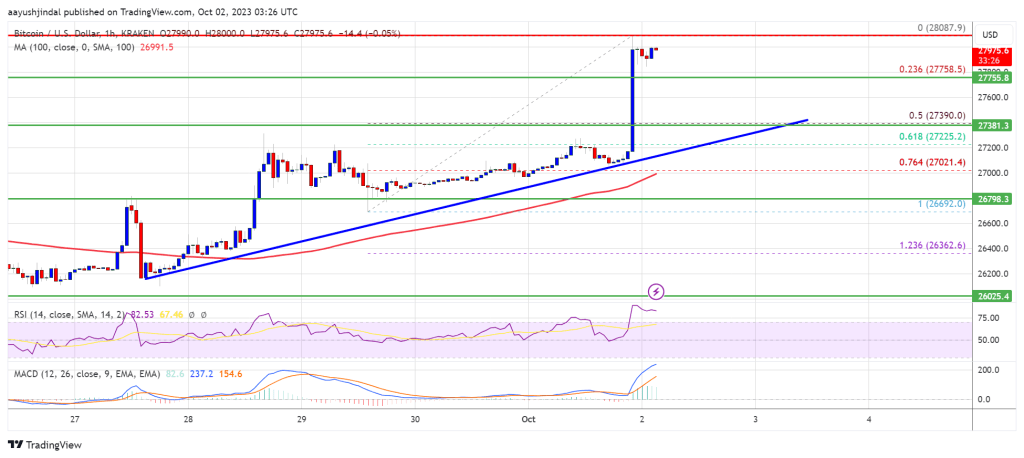
The upward move was such that the price even tested the $28,000 resistance. A high is formed near $28,087 and the price is now consolidating gains. It is trading well above the 23.6% Fib retracement level of the upward move from the $26,692 swing low to the $28,087 high.
Bitcoin is trading above $27,500 and the 100 hourly Simple moving average. There is also a key bullish trend line forming with support near $27,350 on the hourly chart of the BTC/USD pair. The trend line is near the 50% Fib retracement level of the upward move from the $26,692 swing low to the $28,087 high.
Source: BTCUSD on TradingView.com
Immediate resistance on the upside is near the $28,000 level. The next key resistance could be near the $28,200 level. A close above the $28,200 resistance could send the price further higher. In the stated case, the price could climb toward the $28,800 resistance. Any more gains might call for a move toward the $29,500 level.
If Bitcoin fails to continue higher above the $28,000 resistance, there could be a downside correction. Immediate support on the downside is near the $27,750 level.
The next major support is near the $27,350 level or and the trend line. A downside break and close below the $27,350 level might send the price toward $27,000. The next support sits at $26,750. Any more losses might call for a test of $26,200.
Technical indicators:
Hourly MACD – The MACD is now losing pace in the bullish zone.
Hourly RSI (Relative Strength Index) – The RSI for BTC/USD is now above the 50 level.
Major Support Levels – $27,750, followed by $27,350.
Major Resistance Levels – $28,000, $28,200, and $28,800.
[#item_full_content]NewsBTCRead MoreOn-chain data shows the Bitcoin short-term holders have responded to the latest price rally by…
Bitcoin (BTC) is currently hovering above the recently breached $74,000 resistance, positioning to reclaim price…
Despite a recent resurgence in prices, Bitcoin (BTC) and Ethereum (ETH), the two largest cryptocurrencies…
Bitcoin price started a strong increase and traded above the $75,500 zone. BTC is now…
A single on-chain indicator has quietly called every major Bitcoin cycle bottom for the past…
Strategy has once again strengthened its aggressive digital asset vault, adding another billion-dollar allocation of…