Bitcoin price is again declining below $110,000. BTC could continue to move down if it stays below the $110,000 resistance.
Bitcoin started a fresh decline below the $109,500 support.
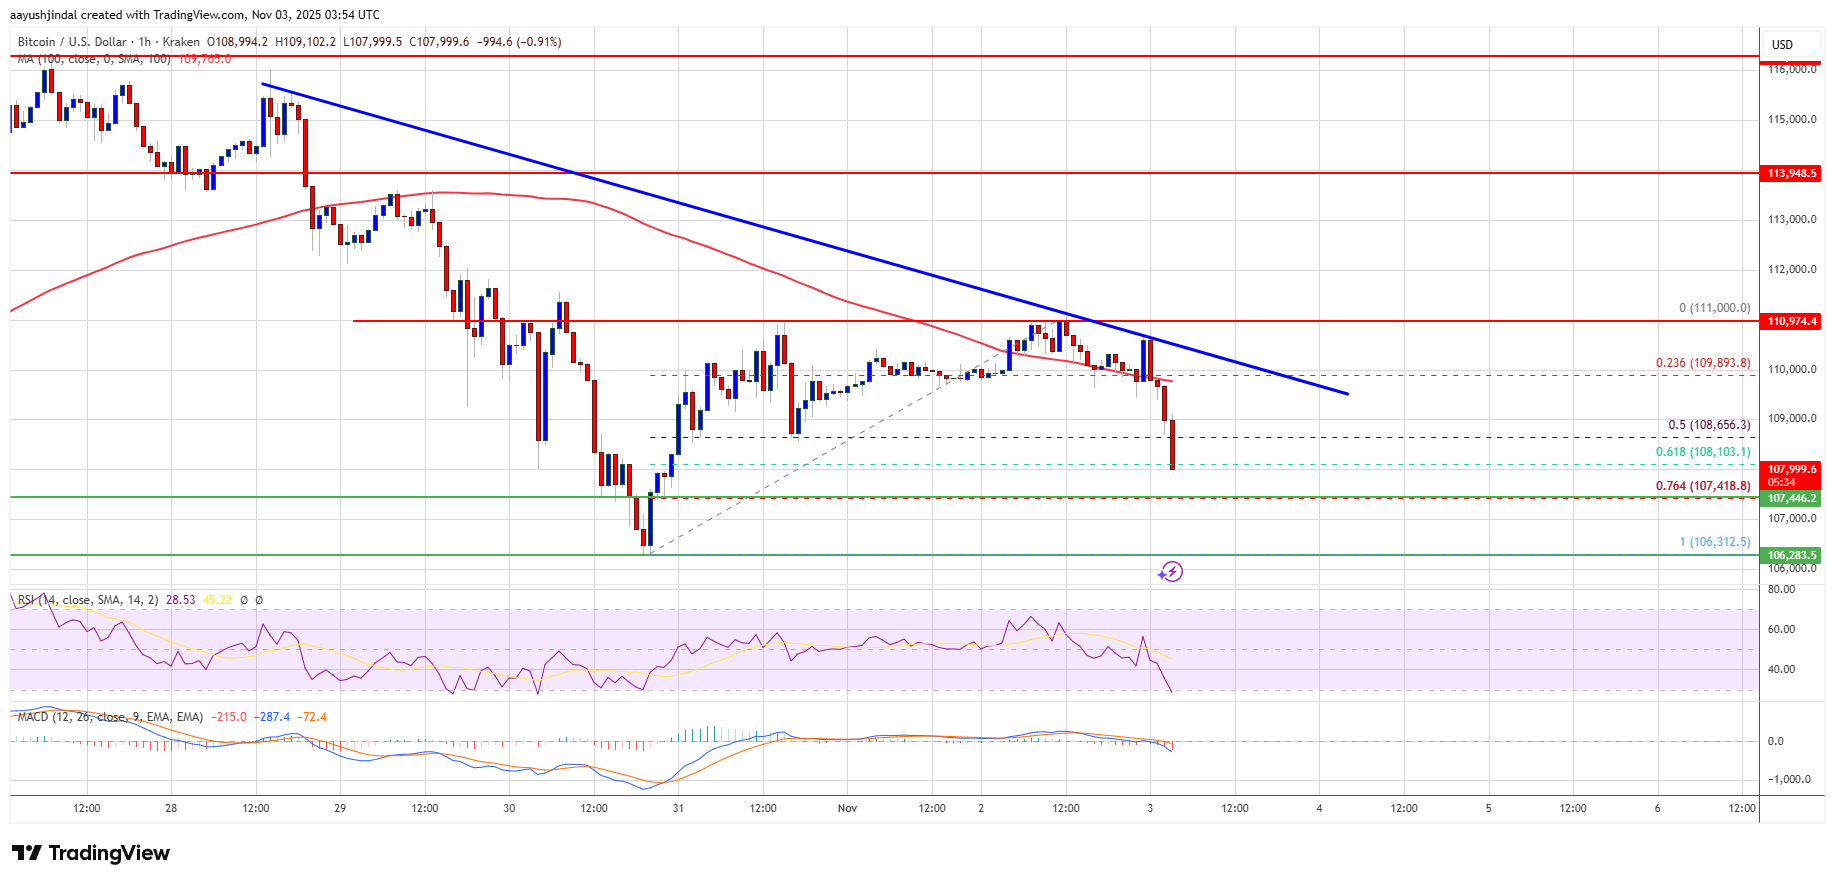
The price is trading below $109,000 and the 100 hourly Simple moving average.
There is a bearish trend line forming with resistance at $109,800 on the hourly chart of the BTC/USD pair (data feed from Kraken).
The pair might continue to move down if it trades below the $107,400 zone.
Bitcoin price failed to stay above the $110,500 pivot level and started a fresh decline. BTC dipped below $110,000 and $109,500 to enter a bearish zone.
The decline was such that the price traded below the 50% Fib retracement level of the upward move from the $106,312 swing low to the $111,000 high. Besides, there is a bearish trend line forming with resistance at $109,800 on the hourly chart of the BTC/USD pair.
Bitcoin is now trading below $109,000 and the 100 hourly Simple moving average. If the bulls attempt a fresh increase, the price could face resistance near the $109,500 level. The first key resistance is near the $109,800 level and the trend line.
The next resistance could be $110,500. A close above the $110,500 resistance might send the price further higher. In the stated case, the price could rise and test the $111,200 resistance. Any more gains might send the price toward the $113,500 level. The next barrier for the bulls could be $115,000 and $115,500.
If Bitcoin fails to rise above the $109,800 resistance zone, it could continue to move down. Immediate support is near the $107,400 level or the 76.4% Fib retracement level of the upward move from the $106,312 swing low to the $111,000 high. The first major support is near the $106,500 level.
The next support is now near the $105,500 zone. Any more losses might send the price toward the $104,200 support in the near term. The main support sits at $103,500, below which BTC might struggle to recover in the short term.
Technical indicators:
Hourly MACD – The MACD is now gaining pace in the bearish zone.
Hourly RSI (Relative Strength Index) – The RSI for BTC/USD is now below the 50 level.
Major Support Levels – $107,400, followed by $106,500.
Major Resistance Levels – $109,800 and $110,500.
[#item_full_content]NewsBTCRead MoreBitcoin traded around $69,800 as open interest rose to $102 billion, suggesting defensive, bearish bets…
Bitcoin (BTC) is currently navigating a trading range between $60,000 and $73,000, entering what analytics…
Tokyo-listed Metaplanet is expanding beyond holding BTC into funding, incubating, and granting to companies building…
The bridging protocol's team wants to exchange ACX tokens for equity in a new U.S.…
Brent crude surged 10% after attacks on two oil tankers in Iraqi waters, with the…
Bitcoin price failed to extend its recovery wave above the $70,500 zone. BTC is now…