Bitcoin price started a fresh increase above the $108,500 zone. BTC is now up over 3% and showing positive signs above the $110,000 level.
Bitcoin started a fresh increase above the $108,500 zone.
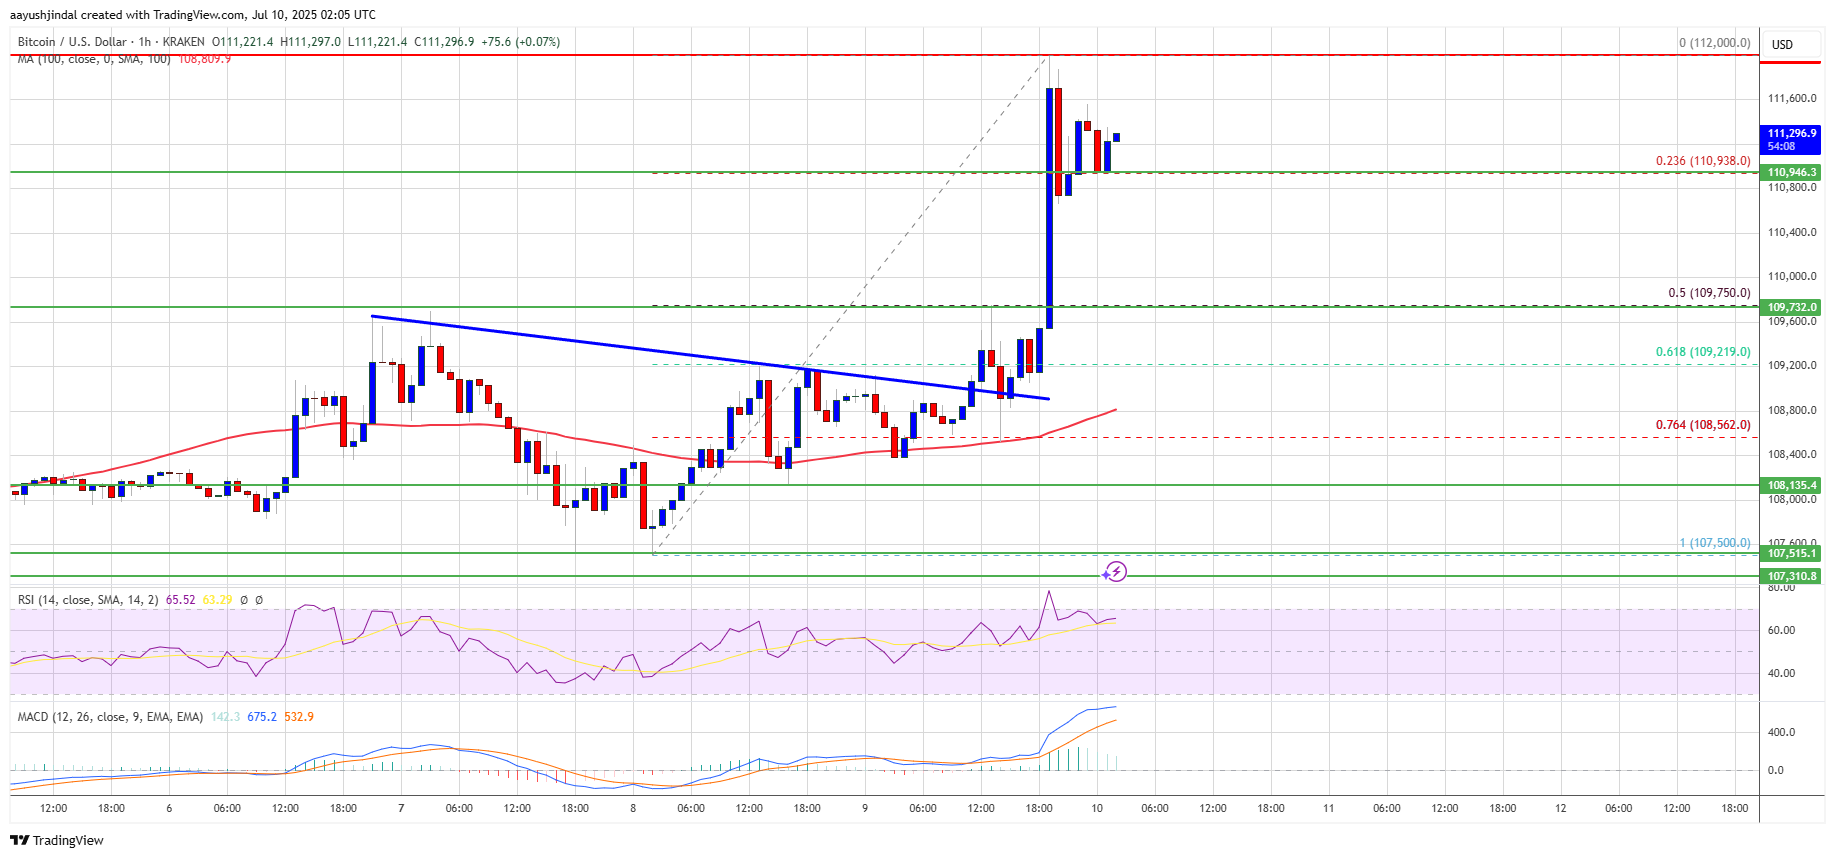
The price is trading above $110,500 and the 100 hourly Simple moving average.
There was a break above a bearish trend line with resistance at $108,800 on the hourly chart of the BTC/USD pair (data feed from Kraken).
The pair could continue to rise if it clears the $112,000 resistance zone.
Bitcoin price started a fresh increase after it cleared the $108,500 resistance zone. BTC gained pace for a move above the $108,800 and $109,500 resistance.
Besides, there was a break above a bearish trend line with resistance at $108,800 on the hourly chart of the BTC/USD pair. The bulls even pumped the pair above the $110,000 resistance zone. It opened the doors for a move toward the $112,000 level.
A high was formed at $112,000 and the price is now consolidating gains. It tested the 23.6% Fib retracement level of the upward move from the $107,500 swing low to the $112,000 high.
Bitcoin is now trading above $109,500 and the 100 hourly Simple moving average. Immediate resistance on the upside is near the $111,600 level. The first key resistance is near the $112,000 level. The next resistance could be $112,500.
A close above the $112,500 resistance might send the price further higher. In the stated case, the price could rise and test the $115,000 resistance level. Any more gains might send the price toward the $116,000 level. The main target could be $118,000.
If Bitcoin fails to rise above the $112,000 resistance zone, it could start a downside correction. Immediate support is near the $110,800 level. The first major support is near the $109,750 level or the 50% Fib retracement level of the upward move from the $107,500 swing low to the $112,000 high.
The next support is now near the $109,200 zone. Any more losses might send the price toward the $108,500 support in the near term. The main support sits at $107,500, below which BTC might continue to move down.
Technical indicators:
Hourly MACD – The MACD is now gaining pace in the bullish zone.
Hourly RSI (Relative Strength Index) – The RSI for BTC/USD is now above the 50 level.
Major Support Levels – $110,800, followed by $109,750.
Major Resistance Levels – $112,000 and $115,000.
[#item_full_content]NewsBTCRead MoreBitcoin Magazine Danielle Moinet Confirmed As A Bitcoin 2026 Speaker Danielle Moinet — known to…
Bitcoin (BTC) is showing technical warning signs that have caught the attention of market watchers,…
Data shows the Bitcoin Funding Rates have turned negative across exchanges recently, indicating bearish bets…
Bitcoin Magazine $1 Million Bitcoin Isn’t as Far-Fetched as It Sounds, Analyst Says Bitcoin reaching…
Bitcoin could be on track for a massive long-term rally if one of the most…
Bitcoin Magazine Netflix Censored Bitcoin Sponsors on Boxer Trunks During Jake Paul vs Anthony Joshua…