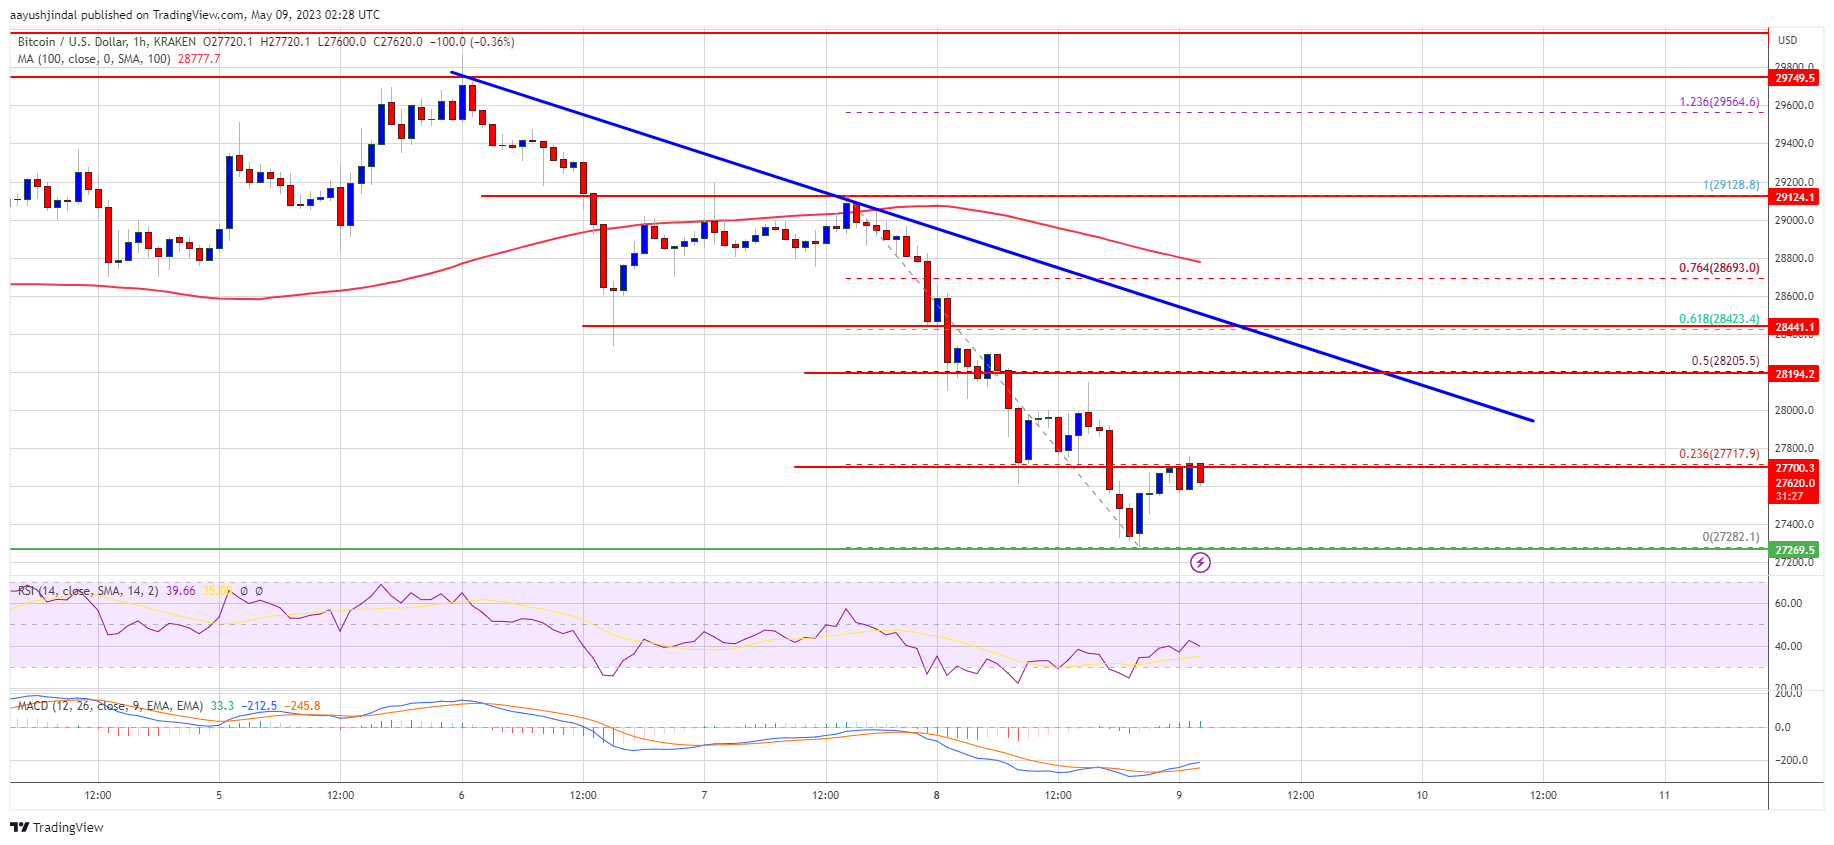
Bitcoin price is moving lower below $28,000. BTC is approaching the $27,000 support, below which there is a risk of an extended decline to $25,500.
Bitcoin is moving lower and trading below the $28,200 pivot level.
The price is trading below $28,000 and the 100 hourly Simple moving average.
There is a major bearish trend line forming with resistance near $28,150 on the hourly chart of the BTC/USD pair (data feed from Kraken).
The pair could continue to move down if there is a move below the $27,000 support.
Bitcoin price started a steady decline after it broke the $28,800 support zone. BTC gained bearish momentum below the $28,200 and $28,000 levels.
The bears seem to be gaining strength and they were able to push the price toward the $27,200 support. A low is formed near $27,282 and the price is now consolidating losses. It is trading below $28,000 and the 100 hourly Simple moving average.
There is also a major bearish trend line forming with resistance near $28,150 on the hourly chart of the BTC/USD pair. Bitcoin is now facing resistance near the $27,750 level. It is close to the 23.6% Fib retracement level of the downward move from the $29,128 swing high to the $27,282 low.
The next major resistance is near the trend line zone or the 50% Fib retracement level of the downward move from the $29,128 swing high to the $27,282 low. A close above the trend line resistance might send the price toward the $28,800 resistance.
Source: BTCUSD on TradingView.com
The next key resistance is near $29,120, above which the price might rise toward the $29,500 resistance zone. Any more gains could open the doors for a decent increase toward the $29,750 resistance.
If Bitcoin’s price fails to clear the $28,150 resistance, it could continue to move down. Immediate support on the downside is near the $27,250 level and the recent low.
The next major support is near the $27,000 zone, below which the price might drop toward the $26,000 support zone. Any more losses might take Bitcoin toward the $25,500 level in the near term.
Technical indicators:
Hourly MACD – The MACD is now gaining pace in the bearish zone.
Hourly RSI (Relative Strength Index) – The RSI for BTC/USD is now below the 50 level.
Major Support Levels – $27,250, followed by $27,000.
Major Resistance Levels – $28,000, $28,150, and $28,800.
[#item_full_content]NewsBTCRead MoreFor years, investors had valued the firm well above its bitcoin holdings, giving Strategy massive…
TL;DR CryptoQuant-linked data shows Bitcoin apparent demand remaining negative for 208 consecutive days. The metric…
Ripple's Brad Garlinghouse called Strategy's preferred-stock funding model "financial engineering" that distracted the market, pointing…
Bitcoin’s latest pullback was not driven by a single headline. Instead, traders were hit by…
Tokenized stock trading fueled fresh momentum across the Solana ecosystem, while Aave founder hinted at…
Ripple CTO Emeritus David Schwartz has clarified a long-running point of confusion in the XRP…