Bitcoin price is attempting to recover above $113,500. BTC could rise further if there is a clear move above the $115,500 resistance.
Bitcoin started a fresh recovery wave above the $113,500 resistance level.
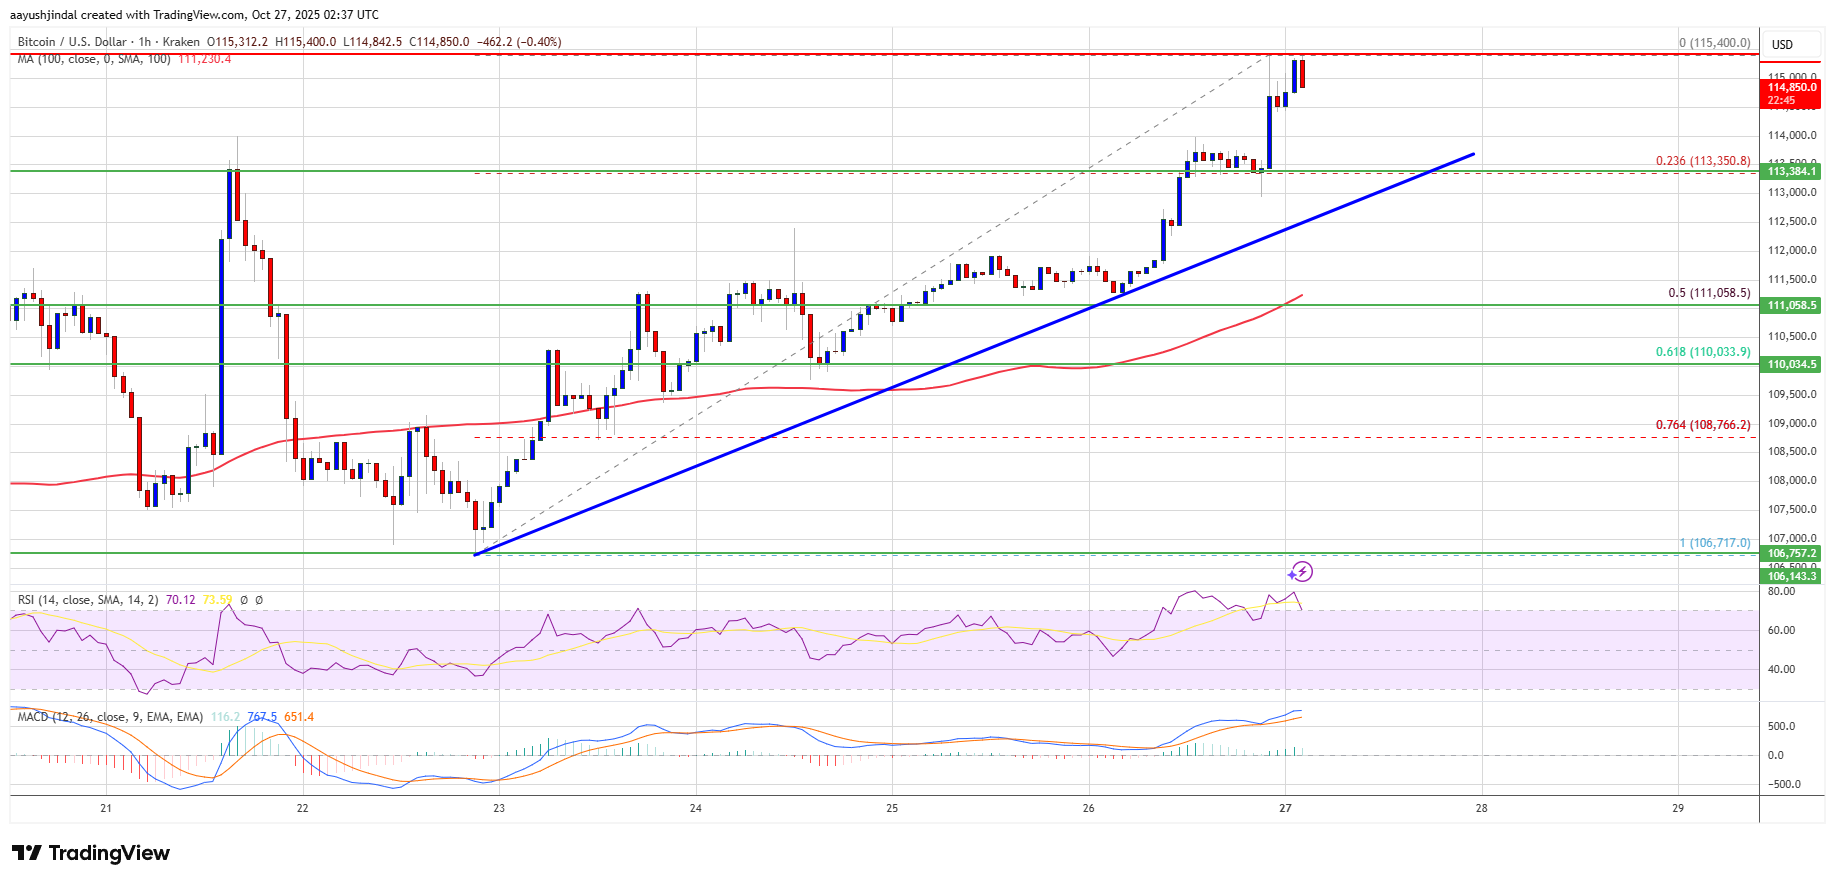
The price is trading above $114,000 and the 100 hourly Simple moving average.
There is a bullish trend line forming with support at $113,350 on the hourly chart of the BTC/USD pair (data feed from Kraken).
The pair might continue to move up if it trades above the $115,500 zone.
Bitcoin price declined again below the $108,000 level. BTC tested the $106,720 zone and recently started a fresh increase. There was a move above the $112,000 resistance level.
The bulls were able to pump the price above $113,500 and the 100 hourly Simple moving average. Finally, the price spiked above $115,000 and is currently consolidating gains above the 23.6% Fib retracement level of the recent wave from the $106,718 swing low to the $115,400 high.
Besides, there is a bullish trend line forming with support at $113,350 on the hourly chart of the BTC/USD pair. Bitcoin is now trading above $114,000 and the 100 hourly Simple moving average.
Immediate resistance on the upside is near the $115,250 level. The first key resistance is near the $115,500 level. The next resistance could be $116,200. A close above the $116,200 resistance might send the price further higher. In the stated case, the price could rise and test the $117,000 resistance. Any more gains might send the price toward the $118,000 level. The next barrier for the bulls could be $118,800.
If Bitcoin fails to rise above the $115,500 resistance zone, it could start a fresh decline. Immediate support is near the $114,000 level. The first major support is near the $113,500 level or the trend line.
The next support is now near the $111,000 zone. Any more losses might send the price toward the $110,500 support in the near term. The main support sits at $108,500, below which BTC might struggle to recover in the short term.
Technical indicators:
Hourly MACD – The MACD is now gaining pace in the bullish zone.
Hourly RSI (Relative Strength Index) – The RSI for BTC/USD is now above the 50 level.
Major Support Levels – $114,000, followed by $113,500.
Major Resistance Levels – $115,500 and $116,500.
[#item_full_content]NewsBTCRead MoreAnalysts predict a rally to $300,000 or more by 2029. But key data suggests the…
Bitcoin Tests $59,000 as Traders Look For A Cleaner Rebound After Supply Pressure is the…
Bitcoin Magazine Metaplanet Announces Joint Study to Bring Bitcoin-Backed Digital Credit to Japan Metaplanet wants…
Fidelity Leads Bitcoin ETF Inflows as Institutional Demand Shows Signs Of Life Again is the…
Bitcoin Magazine Bitcoin is “A Screaming Buy”: Standard Chartered Backs $100,000 Target, Shrugs Off Strategy…
Your day-ahead look for July 10, 2026Read MoreCoinDesk: Bitcoin, Ethereum, Crypto News and Price Data[#item_full_content]